

A look at previous bitcoin bear market cycles shows two distinct phases of capitulation and can give insight into how much longer the bear market will last.

The below is an excerpt from a recent edition of Bitcoin Magazine Pro, Bitcoin Magazine’s premium markets newsletter. To be among the first to receive these insights and other on-chain bitcoin market analysis straight to your inbox, subscribe now.
Price-Based Capitulation Versus Time-Based Capitulation
A look at previous bitcoin bear market cycles shows two distinct phases of capitulation:
- The first is a price-based capitulation, through a series of sharp selloffs and liquidations, as the asset draws down anywhere from 70 to 90% below previous all-time-high levels.
- The second phase, and the one that is spoken of far less often, is the time-based capitulation, where the market finally begins to find an equilibrium of supply and demand in a deep trough.
Let’s cover both of these phases with visuals and data derived from the blockchain.
Bitcoin Drawdowns from All-Time Highs
While much has been written about the macroeconomic backdrop regarding the bitcoin market (with our analysis assuredly included), this bitcoin cycle ironically does not look all that different from the cycles of the past.
At the time of writing, bitcoin is 69.72% below previous all-time highs, with the peak of the drawdown reaching 71.86% on May 18. Bear markets of bitcoin’s past saw drawdowns of 93.08%, 84.82% and 83.47% respectively. With this in mind, despite the absolute size of this cycle’s drawdown dwarfing previous cycles, in relative terms this was nothing out of the ordinary for bitcoin.
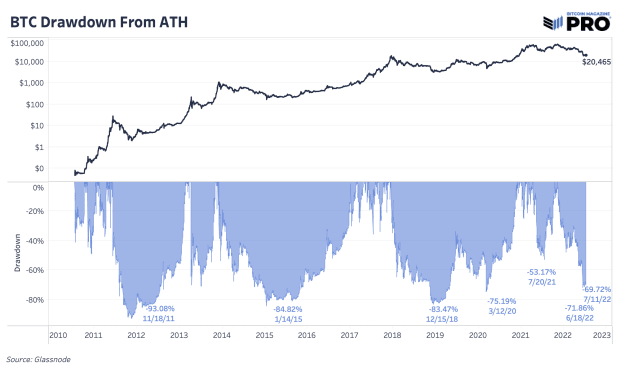
When the average holder of bitcoin is underwater, despite the parabolic gains seen across longer time frames, we view this as a classic price-based capitulation event.
Time-Based Capitulation
What follows the collapse of the market below the average cost basis of the average holder is what we consider the time-based capitulation event. As the average holder is underwater, most marginal sellers have already sold their holdings, and while further downside is possible, the “pain” market participants feel is in the form of a prolonged period of time spent underwater rather than rapidly declining prices that characterized the start of the bear market.
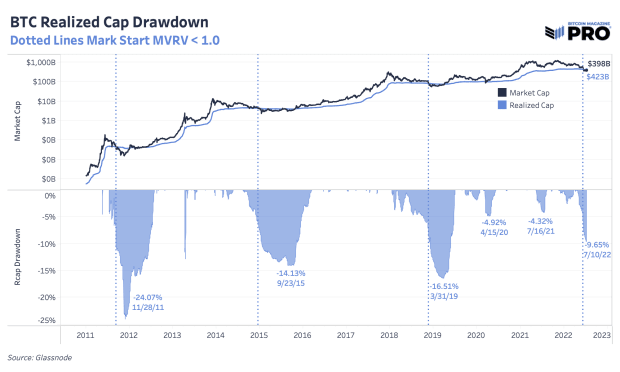
It is also worth noting that as price falls, and market participants capitulate at a loss, the average cost basis (realized price) falls. To contextualize this decline in “fair” value of bitcoin, the history of realized price drawdowns is shown below.
Bear market cycles take time to play out and vary in length depending on how you define them.
In all likelihood, the brunt of the largest capitulation event in the history of bitcoin has just occurred. More balance sheet contagion is certainly on the table (rather hiding under it), and the macroeconomic environment looks increasingly ugly. Holders should buckle in, not just in case of more severe market downturns, but the arguably more painful possibility of extended sideways action together with lower prices and plenty of sideways chop as coins are transferred from weak hands to strong hands, and from the impatient to the convinced.
Bitcoin is here to stay. Your job is simply to survive.
